The World Intellectual Property Organization (WIPO) releases data and statistics[1] compiled over the world of various intellectual properties each year. These include patent, trademark, industrial designs, utility models, and plant varieties. The data is interesting and a few suggestions on the trends can be seen from this data.
First, China (CN) continues to lead the world in intellectual property filings and registrations across the board. This corresponds with China’s huge market which is evident from its economic growth and growing political influence in a number of areas. The US has relatively stable second placements in patents and trademarks, and growth in designs. This reflects the recent US accession to the Hague Agreement on Industrial Designs, which was implemented in the Patent Law Treaty Implementation Act which passed Congress in 2014.
Second, two sets of charts from two data sets of WIPO statistics were reviewed, year-over-year from the most recent years available where comparable data could be extracted (i.e., 2015, 2016; 2017 will be available in January 2019).
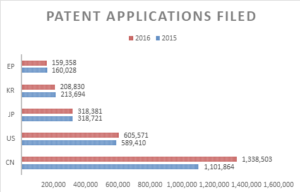
Patent data shows China leading the way, with a 21.5% increase in patent filings in 2016 over 2015. The US was a distant second with less than half the number of filings as China, and a modest 2.7% increase in filings in 2016 over 2015. The remaining top 5 patent countries, Japan, South Korea, and the EPO, all had miniscule decreases over this same time period.
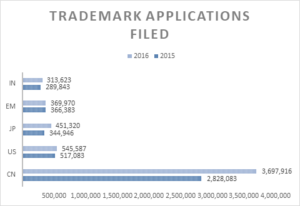
Trademark data also shows the tremendous IP strength in China, with its enormous 14.3% growth in trademark filings in 2016. There were so many, in fact, that the number of trademark filings in the remaining top four countries – US, Japan, EUIPO, and India – were less than half that filed in China combined.
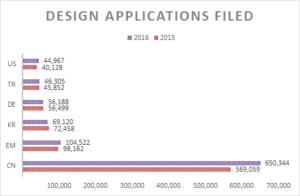
Design data shows China way out in front, with a nearly 31% increase in year-over-year filings. The EUIPO, South Korea, Germany, and Turkey rounded out the top five. It is interesting to note, however, that the US experienced a 12% increase in design patent application filings between 2015 and 2016. Also, it should be noted that the US groups industrial designs with patents, while most countries have industrial designs as a separate IP. Design laws differ from jurisdiction to jurisdiction. For example, industrial designs are examined in the EU through the EUIPO, or the trademark office of the EU. China has only formal examination, while South Korea has a bifurcated system of formal and substantive examination, depending on what design codes the application falls under. US design patent applications must undergo substantive prosecution and pass novelty, nonobviousness, and utility requirements.
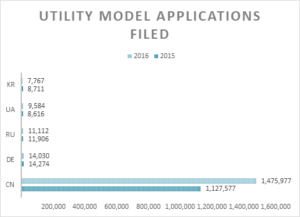
Utility models are a curiosity in the US, since there is no utility model law here. The one interesting note is that China filings far eclipse the rest of the world’s filings combined.
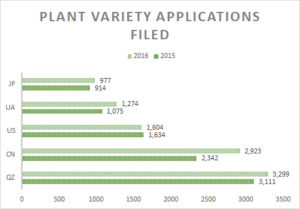
Plant data shows the Community Plant Variety Office of the EU (QZ) with the most filings for 2015-2016. China is a closing second, with the US a third. This would certainly represent a growth area for US consumers. Again, like designs, laws differ greatly around the world. The US is one of only two countries which have two IP regimes to protect plant varieties – plant patents and plant variety protection certificates. The data here is culled from the USPTO and only reflects the plant patent applications.
[1] WIPO (2016, 2017). World Intellectual Property Indicators 2016, 2017. Geneva: World Intellectual Property Organization.
